Environmental review

AREA, STRATEGIC GOALS AND METRICS
Climate action and minimisation of GHG emissions
2028: gross emissionsScope 1 –
Key projects and highlights of 2022
Gross emissions:Scope 1
- Climate Agenda project
- Contracting TGC-1 as a supplier of green energy generated by HPPs
- Assessing the impact of the carbon border adjustment mechanism on the Company’s operating expenses
- Low-carbon transition plan
- Сo-processing of phosphogypsum and carbon dioxide
Minimisation of Scope 2 GHG emissions to
as part of the Energy Efficiency Programme
Key projects and highlights of 2022
Self-sufficiency in electricity supplies- Upgrade of the lighting system to LED Construction of a heat and power plant with a 34 MW exhaust gas turbine and a water treatment system (Volkhov)
Waste recycling 2025:
Key projects and highlights of 2022
- Enhanced ore processing (Kirovsk)
- Use of phosphogypsum
- Implementation of phosphogypsum conversion at Balakovo branch
Minimisation of air emissions 2025: pollutant emissions
Key projects and highlights of 2022
Pollutant emissions- Installation and upgrade of gas recovery equipment in upgraded and new shops (Volkhov)
- Dust suppression of dusty surfaces (Kirovsk)
- Project of upgrading the process to return synthesis and purge gas to the fuel gas system without sending ammonia-containing gases to burners of the steam superheater
Responsible water use
2025: waste water discharge into surface watersKey projects and highlights of 2022
Waste water discharge into surface waters- Second stage of water use optimisation programme (Cherepovets)
- Collection and treatment of seepage water from ANBP-2 tailing dump
Preservation of biodiversity in regions of PhosAgro Group’s operation at a level securing sustainability
Key projects and highlights of 2022
- Development of comprehensive programmes to protect biodiversity (Cherepovets, Volkhov, Kirovsk)
- Release of young fish and larvae into water bodies across the Company’s regions of operation
At PhosAgro, we attach much importance to environmental protection and safety, as well as climate risk management, putting every effort into all of these areas to secure the Company’s sustainable development and well-being of the regions across its geography.
Our Strategy to 2025 is designed to observe strict compliance with legislative environmental responsibility standards and practices aimed at minimising the impact of the Company’s operations throughout the whole life cycle of a fertilizer, from mine to food products.
We strive to produce fertilizers in a safe and eco-friendly manner, thus contributing to the sustainable agricultural development worldwide. Committed to continuous improvement, the Company keeps working to lessen the environmental impact of its production operations and across the value chain.
The key priorities set out in PhosAgro’s Environmental Policy are careful use of natural resources and reduction of the environmental footprint.
We had a comprehensive assessment of our operations, determining key focus areas of such impact, both direct and indirect, and weighed it against the UN Sustainable Development Goals (UN SDGs).
Based on the assessment results, we mapped out six strategic focus areas of environment protection, including:
Since 2020, we have been implementing the Climate Strategy based on PhosAgro’s vision and expertise in GHG emissions management. The document reviews climate risks and opportunities extensively, setting targets for GHG emissions and presenting the low-carbon transition plan.
The Company acts on the Energy Efficiency Programme designed to ensure compliance with the Climate Strategy and the Energy Efficiency and Energy Saving Policy tightly integrated into the Company’s Strategy to 2025.
Strategy to 2025 also seeks to minimise waste generation substantially. Having developed a system for accumulating and analysing data on production and consumption waste from our operations, we are now implementing a range of projects aimed at minimising waste generation and increasing the share of recycled waste.
In the scope of the strategic objectives to minimise air emissions, PhosAgro is running a programme to re-equip production facilities and cut pollutant emissions.
In addition, in 2020, we adopted the Water Strategy to minimise our impact on water bodies by means of lean treatment of resources: less water withdrawal and waste water discharge. As part of the Strategy, we assessed water use risks and opportunities, including potential scarcity of water resources, set targets for water withdrawal and waste water discharge and designed a detailed action plan for each site to achieve the targets.
PhosAgro sticks to its biodiversity management system comprising the assessment of potential impact, interaction with a wide range of stakeholders, as well as monitoring and reporting practices.
We believe that our requirements should be uniform both for us and our partners engaged in PhosAgro’s projects. Everything we require of ourselves equally applies to our counterparties and is enshrined in the Code of Conduct for Counterparties.
Effective environmental management is key to PhosAgro’s long-term sustainability and indicative of the Company’s commitment to run a socially responsible business, balancing its obligations to a wide range of stakeholders.
Traditionally, we put a special focus on environmental matters and stand in unconditional support of the vulnerable and rare habitats across our geography, leaving them intact and carefully treating natural systems and resources. Our operations undergo a stringent assessment for compliance with the Environmental Policy and the Company’s internal regulations.
We adopted a unified approach to environmental management that relies on

Putting Strategy to 2025 into action and compliance with the Company’s environmental policies are overseen by the Strategy and Sustainable Development Committee that regularly reports on the Company’s progress to the Board of Directors. The Environmental Protection Department exercises executive control over the Company’s environmental activities.

The consistency of PhosAgro’s activities aimed at environmental protection and strengthening of the Company’s environmental performance results from continuous development of the environmental management system that was recertified according to ISO 14001 in 2022.

Our environmental management system relies on strict compliance with applicable laws and regulations.
Environmental management system
Our environmental management system is integrated with the Company’s overall management framework and is a key element in our approach to managing environmental responsibility
Our strategic environmental protection goals are set out in the Company’s Strategy to 2025, climate and environmental agendas and their achievement is included in the KPIs of managers and senior executives.
Compliance
Environmental compliance is key to running a responsible business.
PhosAgro's environmental management practices ensure our compliance with the applicable environmental and nature conservation regulations. To that end, the Company has developed an internal and external control framework, which includes internal audit and external compliance reviews, a reporting system designed in accordance with legislative requirements, and a staff training system.
All our facilities that have an adverse environmental impact are included in dedicated state registers, with relevant categories assigned to them. PhosAgro has all necessary permits in place for each of these facilities.
None of PhosAgro’s enterprises uses ozone-depleting substances in the production process. A small amount (not more than 250 kg/year) of carbon tetrachloride (CCl4) is used for some laboratory testing.
We do not undertake cross-border hazardous waste transportation and our production sites are not situated in protected areas. Hence, there are no significant restrictions on our operations.
The slight decline in expenses in 2022 was due to the fact that the bulk of CAPEX associated with the Company's key environmental investment project, the aluminium fluoride production upgrade in Cherepovets, was incurred in 2021. In 2022, a considerable part of investment projects with an environmental impact were at the design stage.
The Company took steps to remedy the harm caused by an emergency in 2019 by committing RUB 2,274,000 to the reproduction of aquatic biological resources in 2022.
In 2022, local bodies of the Federal Service for Supervision of Natural Resources carried out nine unscheduled audits of Apatit, including six audits of class 1 capital construction projects, resulting in Apatit being held administratively liable under Articles 8.1 and 8.2 of the Code of Administrative Offences of the Russian Federation and required to pay a penalty of RUB 190,000.
In 2022, over-limit payments accounted for 1.22% of total environmental impact payments. An over-limit payment was calculated and paid due to exceeding the permissible emission limit for nitrogen oxides by one of the emission sources at the Cherepovets facility. Nevertheless, the increase in the Company's environmental impact payments in 2022 was 8%, while the statutory indexation rate for environmental impact payments in 2022 was set at 10%, which points to the effectiveness of our efforts to reduce emissions.
Assessment, analysis, and monitoring
Continuous improvement is inherent in our environmental management. The Company identifies areas for improvement by reviewing its management system using an effective mechanism, which includes external and internal audits of the environmental management system (EMS), activities to monitor and assess the Company's performance, including by a wide range of stakeholders, and the analysis and assessment of the Company’s performance by the Company’s management. These efforts enable the Company to work out corrective action plans and proposals on how to develop and improve the EMS.
Stakeholder engagement is essential for the Company’s planning. Public hearings are a legitimate and effective mechanism for establishing dialogue with stakeholders using a discussion platform to express their opinions and make suggestions on the initiatives under consideration. This mechanism has a positive impact on the decision-making process and improves its efficiency. Engaging the general public and a wide array of stakeholders in discussion plays an important role and helps ensure that all points of view are considered.
PhosAgro public hearings coverage
Environmental risk management is an integral part of the Company's risk governance framework.
The following strategic risks affect our environmental protection objectives:
The environmental protection risks include:
The Company develops corrective measures as necessary and unlocks opportunities to mitigate those risks. Below you can find more information about what we do on this front.

Reduction of specific Scope 1 emissions
PhosAgro has LEAD status under the UN Global Compact and is a participant of the Climate Ambition, an initiative launched under the UN Global Compact. In 2021, the Company partnered with CGI Russia (Climate Governance Initiative), an organisation established by the World Economic Forum to raise awareness and boost efficiency of boards of directors with respect to climate change. The organisation assists in developing climate strategies and implementing them, as well as integrating the climate change agenda into day-to-day and long-term business decisions.
Starting from 2021, PhosAgro publishes an annual TCFD report fully addressing the climate aspects of its operations, strategy, risks, opportunities, governance, performance, and metrics. In June 2021, PhosAgro publicly declared support for the TCFD and its recommendations.
The Company’s representatives are members of climate change and sustainable development task and expert groups instituted by government authorities and non-governmental organisations, and are actively engaged in discussions on current global challenges.
Strategy and management approach
The Company focuses on climate change in line with the double materiality principle. On the one hand, it identifies and assesses the impact of its operations on climate all along the value chain from extraction of raw materials to consumption of finished products. On the other hand, it projects how climate change affects PhosAgro's business, strategy, and financial planning.
Climate matters feature prominently in PhosAgro Group’s strategic and investment decisions, as well as in its day-to-day business management. In 2022, we developed mechanisms to integrate the internal carbon price into the evaluation of investment projects and introduced them in early 2023. The Company has identified, assessed, and prioritised climate risks, establishing their short, medium and long term consequences for its production and business processes. We make our strategic plans and day-to-day management decisions with full awareness of the nature and extent of climate impact (both environmental and political) on the Company’s business, strategy, and financial planning. The Company develops and takes systemic measures to reduce its carbon footprint and closely interacts with partners across its value chain (suppliers and consumers) and other stakeholders in Russia and worldwide.
PhosAgro's Climate Strategy was adopted in 2020. It is a comprehensive document setting out the Company's climate policy in the face of growing climate change and uncertainty.
- Setting up targets to minimise GHG emissions in line with the Science Based Targets initiative; using climate scenario analysis
- Integrating climate risks into the comprehensive risk management framework for investment and day-to-day business activities
- Focusing not only on technology-related measures, but also on proper organisation and management, as well as changes in the social and personnel policy in the effort to reduce GHG emissions
- Identifying not only risks, but also attractive climate-related investment opportunities and making long-term plans for them
- Promoting awareness of the Company's climate initiatives and plans, as well as cooperation in specific areas.
The Strategy has set the following goals:
- to minimise GHG emissions while increasing output;
- to improve energy efficiency and environmental performance of the key production processes;
- to reduce energy and carbon intensity per unit of output;
- to enter into new emerging markets for green products;
- to retain and expand the existing market niches by ensuring PhosAgro’s competitive edge in terms of energy and carbon intensity.

PhosAgro is currently focused on creating particular metrics reflecting the impact of climate action in production and management processes on financial indicators. The Company has analysed the impact of the carbon border adjustment mechanism (CBAM) on PhosAgro’s operating expenses. The new mechanism will cover Russian industrial products, including, most likely, mineral fertilizers. Given the uncertainties as to the emission scopes the CBAM will apply to, the ability to account for PhosAgro’s individual emission levels, and the changing carbon dioxide prices, we have determined the estimated ceiling and floor of the mechanism’s impact on the Company’s financial performance in 2023–2030.
Actions to deliver the Climate Strategy
The Climate Agenda project was implemented to create the climate action management system and push forward the low-carbon transition plan.
In 2022, we developed technical and technological initiatives to reduce direct GHG emissions with due regard to their economics. To this end, we engaged one of the global leaders among consulting firms.
Apart from that, the following has been developed as part of the project:
The Company's experts continued to explore options for absorbing greenhouse gases in order to select the most suitable ones. In 2022, we launched the Carbon Footprint Compensation project aimed at absorbing (compensating for) GHG emissions, with a carbon footprint compensation farm being set up in the Vologda region. Its pilot site was organised in 2022.
The low-carbon transition plan is based on the specialised research data and seeks to support economic development of PhosAgro that builds on the priority of keeping GHG emissions to a minimum. It is implemented to ensure that the GHG emission reduction targets are delivered across all scopes.

Risks and opportunities
PhosAgro identifies its climate risks and opportunities taking account of climate change. The process is influenced by physical (changes in natural processes or phenomena) and transitional (changes in the policy and regulation with a view to fulfilling low-carbon transition) factors of various nature.
Risks
R1 – disruptions in production processes and logistics operations due to increasing acute climatic effects and other climate-related factors.
R2 – flaws in supply chains, construction design, health and safety; negative environmental footprint and reduced flows of ecosystem services; lower resilience of infrastructure and communications due to increasing climatic effects.
R3 – PhosAgro Group’s failure to comply with regulations reducing its negative environmental footprint (following the adoption of the carbon border adjustment mechanism).
R4 – deterioration of the Company’s sustainability reputation.
R5 – increased costs and losses (as a result of customers’ failure to meet their obligations, rising prices for feedstock, materials and services, higher borrowing rates) and shrinking revenues (as a result of a decline in sales, customers, countries and regions of operation).
Opportunities
O1 – boosting PhosAgro Group’s appeal as an environmentally and climatically responsible supplier of products with a positive climate profile.
O2 – improved logistics driven by the new export opportunities amid shortened seasonal freeze-up of rivers and lakes due to climate change.
O3 – new financial products that open up new sources of cheaper funding (such as green bonds) for companies that embraced environmental and climate sustainability.
Climate scenario analysis
The Company views climate scenario analysis as a tool to make its climate strategy resilient to uncertainties and risks related to climate change. In line with that, we adopted climate scenarios and determined respective scenario parameters that are most probable and significant for the Company in the short, medium and long term.
PhosAgro assessed the impact of climate-related risks and opportunities on its operations under two climate change scenarios: global warming of 2°С and 4°С. The key features of the scenarios are:
- 2°С scenario is expected to result in stringent climate policy measures that will increase market volatility (goods, services, finances, etc.). This is projected to bring about low-carbon transition, putting in place mechanisms of a low-carbon economy that will slow down physical climate-related impacts going forward;
- 4°С scenario is expected to result in less stringent climate policy measures as compared to the 2°С scenario, triggering faster physical climate-related changes.
PhosAgro identified projected changes in climate risks and opportunities under the adopted climate scenarios based on risks, opportunities, scenario parameters, and time frames. In doing so, the Company focused on its operations, strategy, and financial planning.
We identify, assess, and manage climate risks within our comprehensive risk management framework. Covered value chain stages – direct operations up and down the value chain. Climate risk management process is baked in the company-wide risk management processes.
The assessment is done quarterly. Covered time horizon(s) – short-term, medium-term, long-term.
The Company’s climate risk management forms an integral part of its comprehensive risk management system (RMS), with all its elements embedded in PhosAgro’s existing structure. The RMS relies on the Company’s Risk Management and Internal Control Policy and other internal policies and procedures, as well as the applicable Russian and international standards.

Key initiatives in 2022
Plans for 2023
PhosAgro’s climate metrics are aligned with the goals of the Climate Strategy approved by its Board of Directors.
The Company is working to expand and enhance the quality of climate-related measurements. Most metrics are locked on targets which are aligned with the goals of the Climate Strategy and other commitments of the Company.
The metrics are monitored and reported annually to stakeholders.
The Company’s primary focus is on GHG emissions (carbon dioxide CO2, methane CH4 and nitrous oxide N2O) in all three Scopes (1, 2, and 3). We calculate greenhouse gas emissions in accordance with the international guidelines:
- 2006 IPCC Guidelines for National Greenhouse Gas Inventories;
- The Greenhouse Gas Protocol: Scope 2 Guidance;
- The Greenhouse Gas Protocol: A Corporate Accounting and Reporting Standard (Revised Edition);
- ISO 14064-1 – Specification with Guidance at the Organisation Level for Quantification and Reporting of Greenhouse Gas Emissions and Removals.
Calculations are based on global warming projections of the IPCC report “Climate Change 2021: The Physical Science Basis”.
The Company's efforts include end-to-end monitoring of raw data (Scopes 1, 2 and 3) and analysis of supply chain participants’ data (Scopes 2 and 3).
The targets are set in line with minimum qualitative and quantitative criteria based on RCP 2.6, a representative concentration pathway for reduction of global anthropogenic emissions, in order to keep global temperature rise below 2°C by 2100.

Scope 3 greenhouse gas emissions were calculated for the above categories after an expert review identified them to be the most significant emission sources for the Company.
We have chosen 2018 as the base year for calculations because it was the Company’s first GHG inventory year, and given the need to set GHG reduction targets for all three scopes based on the available emission data. In 2018, GHG emissions were as follows: direct GHG emissions (Scope 1) – 4,624.6 kt of CO2-eq., indirect GHG emissions (Scope 2) – 924.1 kt of CO2-eq., and other indirect GHG emissions (Scope 3) – 11,413.8 kt of CO2-eq.
In 2022, Scope 1 GHG emissions declined by 17.3 kg/t, or 11.5%, vs 2018. In 2022, the reduction in total Scope 1 GHG emissions thanks to lower emissions per unit of finished and semi-finished products excluding the production volume growth totalled 638.9 kt vs the base year. The reduction in emissions was primarily driven by the Energy Efficiency Programme and above all the heat and power plant project at the Volkhov branch.
For energy indirect (Scope 2) emissions, the reduction was 7.8 kg/t (or 25.9%) vs the 2018 level; the effect for total Scope 2 emissions excluding the production volume growth stood at 287 kt compared to the base year. The reduction was achieved thanks to the green electricity procured by the Kirovsk branch of Apatit, as well as energy efficiency initiatives.
Total Scope 3 GHG emissions were up by 1,851 kt in 2022 vs 2018, or by 16.2%, reflecting increased product shipments and higher consumption of input resources and, consequently, their total carbon intensity. Excluding the production growth effect, Scope 3 GHG emissions decreased by 427.4 kt vs 2018 thanks to the reduction of emissions per unit of finished and semi-finished products (by 3%).
The values of Scope 3 GHG emissions for 2020 and 2021 differ from the data previously provided by the Company in its CDP questionnaires for respective periods. The main reason for such changes are adjustments made to the calculation methodology following approval of the Guidelines for Climate Impact Management of PJSC PhosAgro and other Group Entities. Furthermore, the value for 2021 was adjusted due to a technical error identified in the Use of Sold Products category as part of a verification process.
The reduction was underpinned by the implementation of the Company’s Strategy to 2025 and Energy Efficiency Programme.
The decrease in per unit energy consumption vs the data disclosed in reports for the previous years and recalculation of values for comparable periods were due to the application of a new energy resource accounting methodology.
Scientifically justified changes in the accounting methodology that will be described in more detail in this section could be introduced thanks to the implementation of the first stage of the project to analyse and upgrade the energy management system.
These changes enabled PhosAgro to enhance the transparency and completeness of information disclosed to stakeholders with respect to the consumption of energy resources (for example, natural gas) typical for the Company and mineral fertilizer industry. This unlocks new opportunities for developing a more nuanced understanding of all types of energy resources consumed by the Company. The Company will continue delivering on the project, as it will help PhosAgro achieve its energy efficiency and GHG emission minimisation goals.
The key driver in 2022 was the completion of construction and the ramp-up of the heat and power plant in Volkhov to its design capacity. Going forward, the Company will continue developing in-house power generation.
We started testing a solar power generation technology at the Company’s facility in Balakovo to assess the viability of a further scale-up for the industrial solution leveraged since 2021. The tests will run until 3Q 2023.

Strategy and management approach
In 2022, PhosAgro continued to follow the Climate Strategy approved by the Board of Directors, the Energy Efficiency and Energy Saving Policy, and the Energy Efficiency Programme, which are tightly integrated into the Company’s Strategy to 2025.
The Energy Efficiency and Energy Saving Policy sets out the following key goals:
The Company pays particular attention to energy efficiency risks.
- A sufficient and reliable energy supply is a material aspect and major concern for us. We thoroughly explore all opportunities to transition to renewable energy: among other things, in 2022, we purchased electricity generated by hydroelectric power plants on the Kola Peninsula.
- Risk of Scope 2 GHG emissions to be included in carbon regulation in the EU and other jurisdictions. The Company’s energy efficiency directly affects Scope 2 GHG emissions, which poses a potential risk, for example after full-scale implementation of carbon border adjustment mechanisms.
- Market availability of electricity from renewable energy sources. The Company continuously monitors the market to ensure a sufficient supply of electricity from renewable energy sources.
The initiatives set out in the Energy Efficiency Programme are aimed at improving energy efficiency, developing energy management at each production site, and achieving strategic objectives in the following focus areas:
In 2022, we implemented comprehensive energy efficiency projects at all of our sites.
Key initiatives in 2022
The energy efficiency metrics are used to monitor the Company’s progress towards its energy efficiency improvement target and are set forth in PhosAgro’s Energy Efficiency Programme and Action Plan, which helps keep track of electricity generation and consumption, energy intensity, etc.
The energy efficiency metrics are based on PhosAgro’s raw data and are calculated in accordance with the approved statistical methodologies. The Company prepares its energy efficiency reports in accordance with the GRI 302: Energy 2016 standard.
In 2022, the Company’s production facilities were 42.9% self-sufficient in terms of electricity needs, which is 2.6% more than in 2021. In absolute terms, the electricity generated by PhosAgro went up by 150 mln kWh year-on-year, driven by the commissioning of new power generating facilities at the Volkhov branch. Total electricity consumption grew by 115 mln kWh year-on-year, which is attributable to the commissioning of new production facilities at the Volkhov branch. In 2023, the share of electricity generated in-house is likely to further increase due to the ramp-up to design capacity of the heat and power plant in Volkhov.
In 2022, the volume of carbon-free electricity used in the production of phosphate rock at the Kirovsk branch grew to 300 mln kWh. As a result, green electricity from hydroelectric power plants supplied under an agreement with TGC-1 covers 17.8% of the plant’s output

In 2022, the Company initiated a project to define a set of metrics in energy consumption and energy efficiency to benchmark its performance against leading peers in the mining, chemical, and fertilizer production industries. The next step, which is also underway in 2022–2023, is detailed analysis of the Company’s energy management system and review of gaps in terms of compliance with ISO 50001:2018. Based on the work completed to date, the Company has introduced certain amendments to its disclosure, including in terms of natural gas consumption.
The project showed that in its reporting, the Company is guided by international standards, which require aggregation of data based on total consumption of energy (electricity, heat, natural gas, fuel oil, petrol, LNG, and heating oil). The Company uses natural gas both as fuel and as feedstock in ammonia production. In ammonia synthesis processes, part of the natural gas is sent to the reactor to be used as chemical feedstock to produce hydrogen; however, natural gas is also used for energy needs as fuel (see the chart below).
As a result, for its 2022 reporting, the Company decided to split the total amount of natural gas previously used in calculations of total and per unit energy consumption, so that GRI 302 reporting does not include natural gas that acts as chemical feedstock in ammonia synthesis.
The change in the methodology caused us to recalculate our energy consumptions values for the previous periods on a retrospective basis.
Still, given the link between data of GRI standards and the use of energy consumption data in GHG emission calculations, we carried out a review to make sure the changes in natural gas presentation approach does not compromise our calculations of GHG emissions in ammonia production.
Increase in the share of recycled and decontaminated hazard class 1–4 waste
Strategy and management approach
PhosAgro’s Development Strategy to 2025 stipulates an increase in the share of recycled hazard class 1–4 waste to 40%.
Having developed a system for accumulating and analysing data on production and consumption waste from our operations, we are now implementing a range of projects aimed at reducing waste generation and increasing the share of recycled waste.
The management system covers:
- an inventory of resources that are used to manufacture products and become waste afterwards;
- data on the amount of waste generated from our own operations, including future waste in the form of products or their part provided to customers;
- waste characteristics;
- properties that limit or prevent the recycling (recovery) of the material or product or limit its useful life;
- continuous monitoring of known and potential negative characteristics of certain materials to prevent them from losing their consumer properties and going to waste;
- identification of activities and processes that generate significant amounts of waste.
PhosAgro’s waste management is monitored on a regular basis and discussed by the Strategy and Sustainable Development Committee before being communicated to the Board of Directors.

Key initiatives in 2022
In 2021, we rolled out a Company-wide project to reduce the accumulation of phosphogypsum at dump sites by promoting it in various areas
In 2022, a decision was made to go ahead with an investment project for the
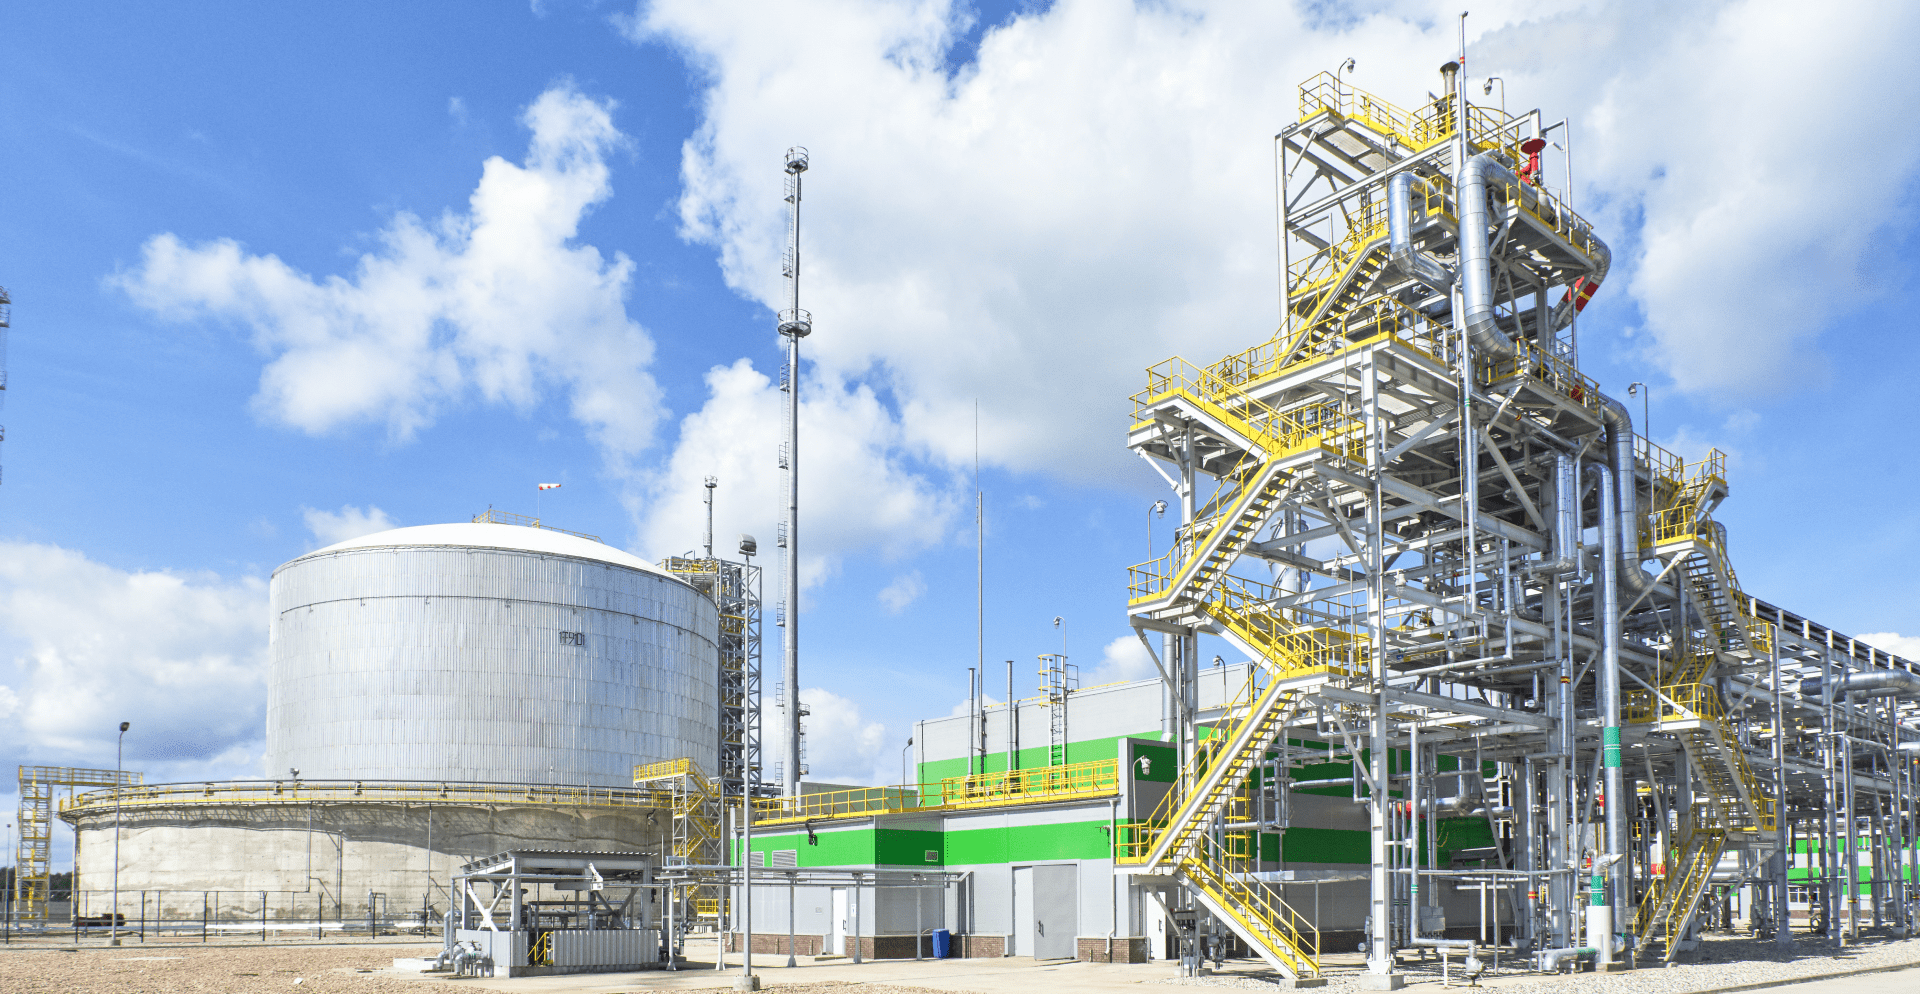
The unit is designed to process by-products of wet-process phosphoric acid – concentrated fluosilicate acid and dihydrate phosphogypsum – to produce a solution of ammonium sulphate and technical calcium fluoride.
The key process stages are as follows: fluosilicate acid is neutralised by ammonia liquor with dihydrate phosphogypsum. With an excess of phosphogypsum, the reaction results in calcium fluoride, silica gel, and a solution of ammonium sulphate. The resulting pulp is then filtered, technical-grade calcium fluoride is washed with water to remove ammonia sulphate and then sent to open air storage, and ammonia sulphate solution is neutralised with sulphuric acid to pH=4.5–5 and sent to the phosphate fertilizers unit to make granulated ammonium sulphate.
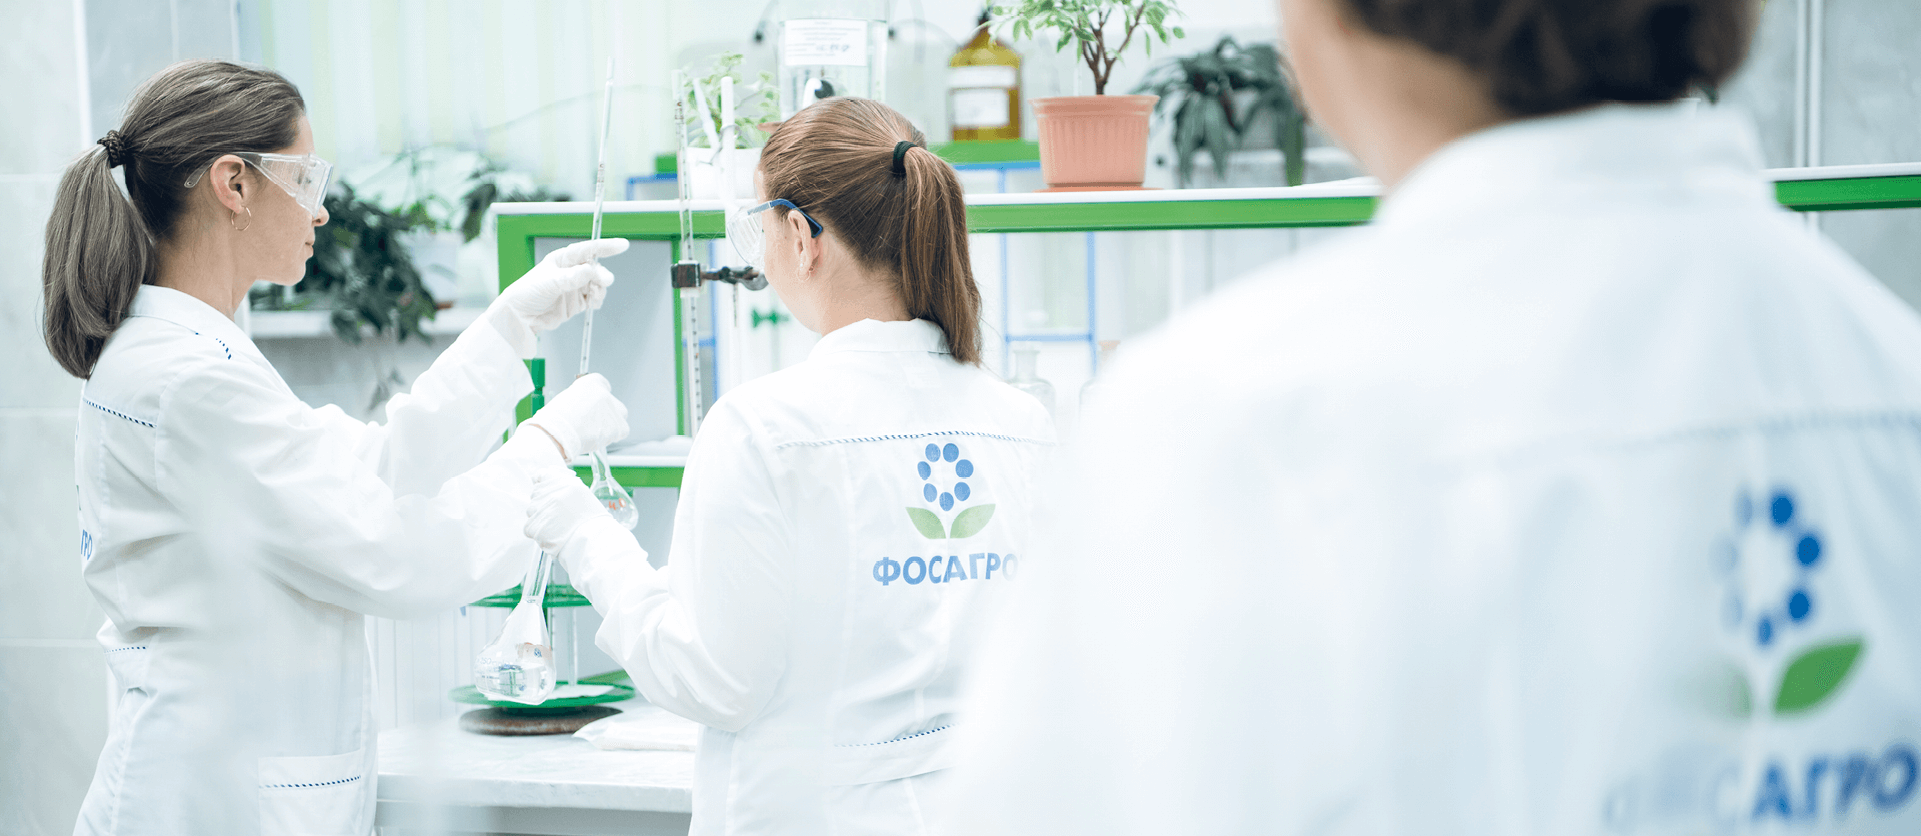
PhosAgro and the Kola Science Centre of the Russian Academy of Sciences have signed a long-term cooperation agreement to implement a project for improving the processing of hard-to-process apatite-nepheline ores. The agreement prioritises joint projects focused on novel production technologies.
One of the outcomes of the cooperation with the Kola Science Centre is the resolution to set up a joint research centre to study key industrial ores, identify optimal mineral liberation and selective flotation modes, conduct technological and mineralogical 3D mapping of ore reserves, as well as select and develop efficient and eco-friendly flotation reagents.
In April 2022, PhosAgro launched project to sell phosphogypsum as a commercial product in seven areas of application:
- ameliorant for farming;
- ground for road surface dressing and soil reinforcement;
- litter in poultry and livestock farming;
- reduction in soil salinity and contamination in urban areas;
- recultivation of unauthorised landfills and lands contaminated with oil products;
- raw material for the cement industry;
- raw material for construction materials (gypsum blocks, construction blocks, and construction mixtures)..
For this project, PhosAgro Group created a sales unit focused on phosphogypsum and tasked with R&D in each of the areas of its application, obtaining regulatory and technical documents, and promotion and sales of phosphogypsum accordingly.
Our project to promote phosphogypsum as a chemical ameliorant agent in agriculture first saw light in February 2021. Its aim is to reduce the accumulation of phosphogypsum at dump sites across our production sites by promoting its agricultural use on saline soils as an ameliorant and source of sulphur, phosphorus and micronutrients.
In 2021–2022, over 50 trials were conducted to apply phosphogypsum in agriculture as an ameliorant for acidic, neutral, alkali and sodic soils. Based on the trials, extra yield averaged between 15% and 35% depending on the crop. Aside from better yields, all commercial products also demonstrated a reliable increase in quality indicators.
As part of the project, PhosAgro established a preparation and loading hub for bulk phosphogypsum and remodelled a railway to ensure its supply to farmers in other regions. In 2022, we were able to ship phosphogypsum in gondola cars and make deliveries to the Moscow, Tambov, Smolensk, Astrakhan and Volgograd regions and the Republic of Tatarstan.
Experiments were conducted to use phosphogypsum as poultry litter in floor housing of broilers. The results showed benefits of using phosphogypsum in the amount of 10–30% of the litter volume.
These benefits include:The use of phosphogypsum helps alter quality indicators of poultry litter:
- an 8–11% increase in the level of nitrogen in litter;
- a 2–3x rise in the level of calcium in litter

The reporting year saw a decline in the share of recycled and decontaminated hazard class 1–4 waste following a slight change in the ratio of recycled waste to waste disposed of, generated by an increased volume of repairs and cleaning of process equipment.

The reduction in class 5 waste generation was due to increased use of overburden as a backfilling material at the Kirovsk branch.

The 2025 target to reduce GHG emissions was achieved. Pollutant emissions, kg per tonne of products and semi-finished products
Strategy and management approach
PhosAgro has developed and now maintains an emissions management process that includes assessment of planned activities, discussion of relevant matters with a wide range of stakeholders, as well as monitoring and disclosing pollutant emissions. To effectively reduce its environmental impact, PhosAgro is running a programme to re-equip production facilities and cut pollutant emissions.
PhosAgro takes part in the government’s Clean Air initiative, which aims to drastically reduce air pollution in major industrial cities across Russia. As part of the initiative, the Company implemented a number of projects that helped reduce emissions by 20% in 2022 vs 2017, despite an annual rise in production output and launch of new capacities.
Air quality in sanitary protection areas near the Company’s production sites complies with applicable hygienic requirements.

Key initiatives in 2022
Apatit’s Cherepovets site implemented four out of five planned activities as part of the Clean Air initiative.
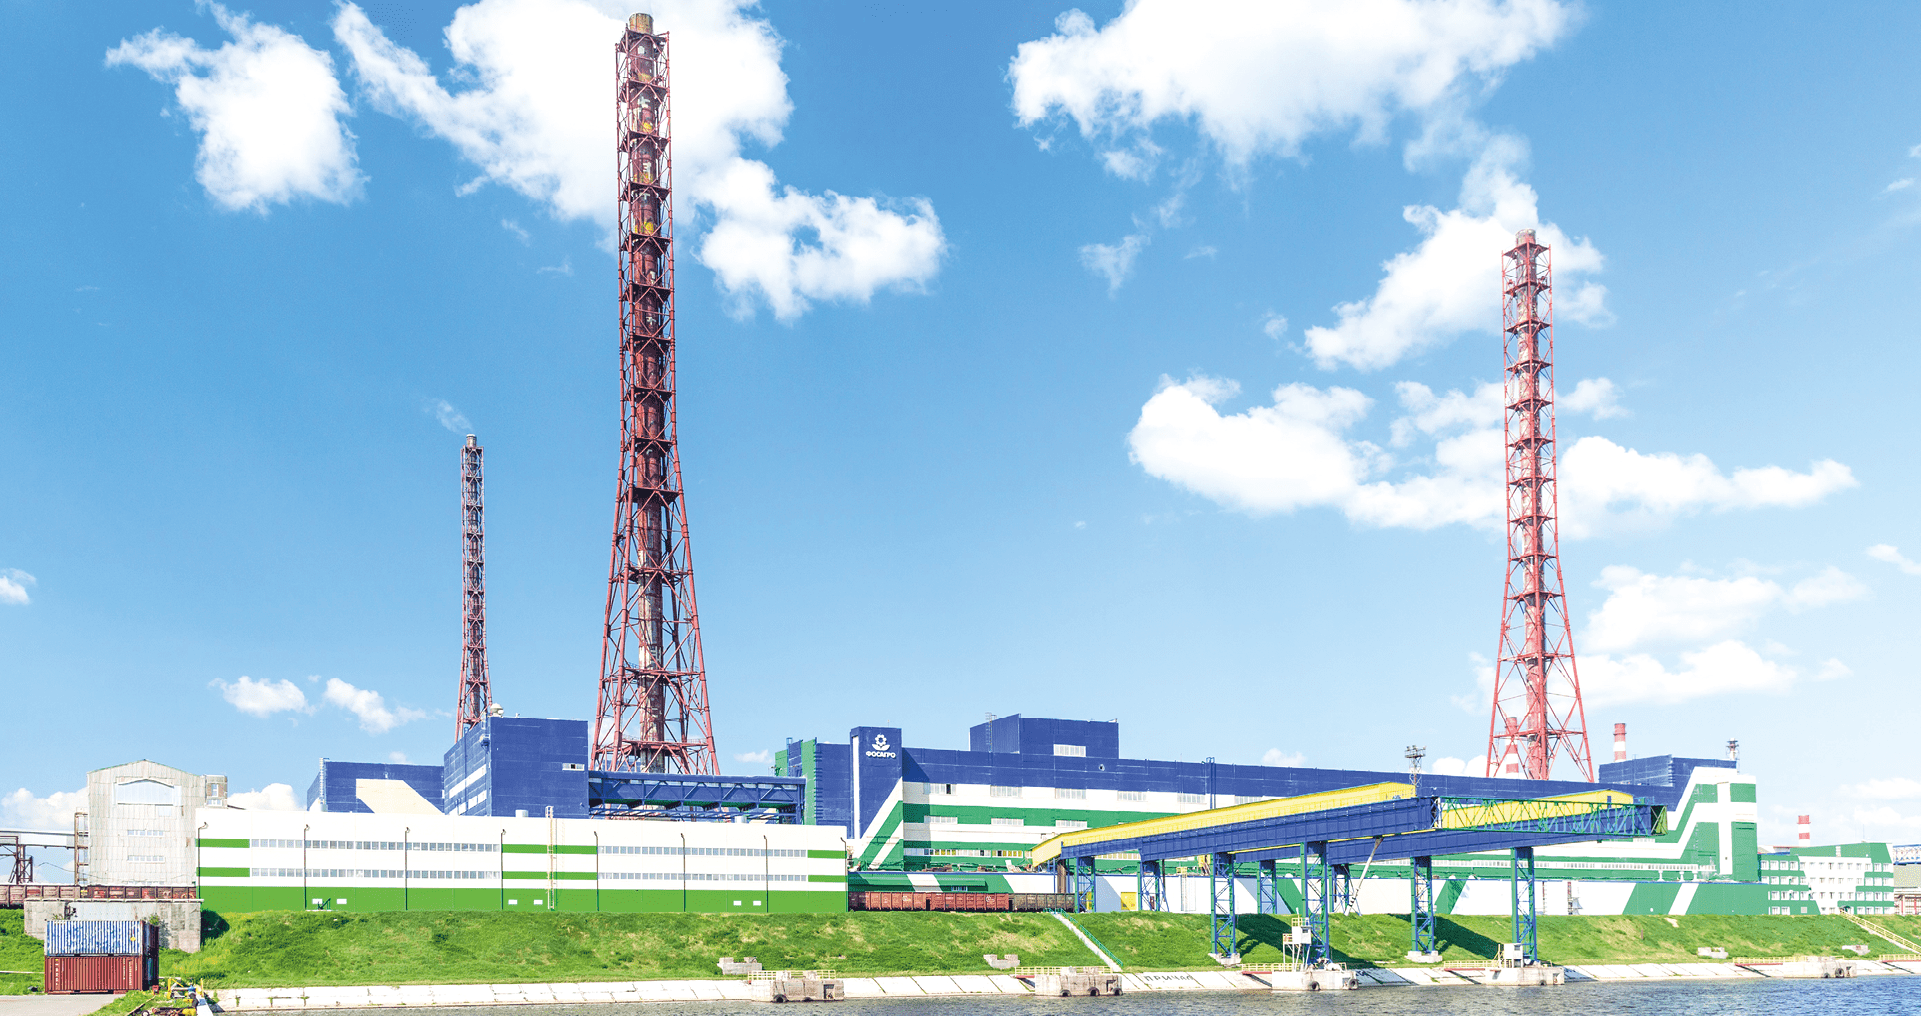
At the Volkhov branch, the key activities of 2021–2022 to reduce the negative impact on the environment, including air, were implemented as part of an investment project to develop the Volkhov site: technical solutions to reduce per unit emissions and concentrations of pollutants at the sanitary protection zone boundaries near residential areas were provided for back at the stages of new construction and upgrades. The considerable reduction in per unit emissions confirms that we have chosen the right approach.
In 2022, the Balakovo branch completed the second stage of technical upgrade at technological systems 5 and 6 of the phosphate fertilizers unit, along with a revamp of gas recovery equipment. The impact will be assessed in 2023.
On an annual basis, Apatit’s Kirovsk branch runs activities to minimise dust emissions from tailing dumps of beneficiation facilities. In 2022, the following work was completed:
- chemical stabilisation using binding agents (PSKh-18 and DUSTBIND) for dusty surfaces in the beach area of tailing dumps:
- – at ANBP-2 across 631.1 ha,
- – at ANBP-3 across 410 ha;
- chemical stabilisation using binding agents (bitumen emulsion) for dusty surfaces in the beach area of tailing dumps:
- – at ANBP-2 across 2.6 ha;
- chemical stabilisation for dusty surfaces on service roads of tailing dumps:
- – at ANBP-2 across 141 ha,
- – at ANBP-3 across 50.7 ha;
- biological stabilisation using hydroseeding for dusty surfaces of dam slopes and beach area of tailing dumps:
- – at ANBP-2 across 3.19 ha,
- – at ANBP-3 across 33.597 ha;
- search for an optimal anti-dusting agent, with pilot tests held for nine new samples.

vs 2021
vs 2021
Strategy and management approach
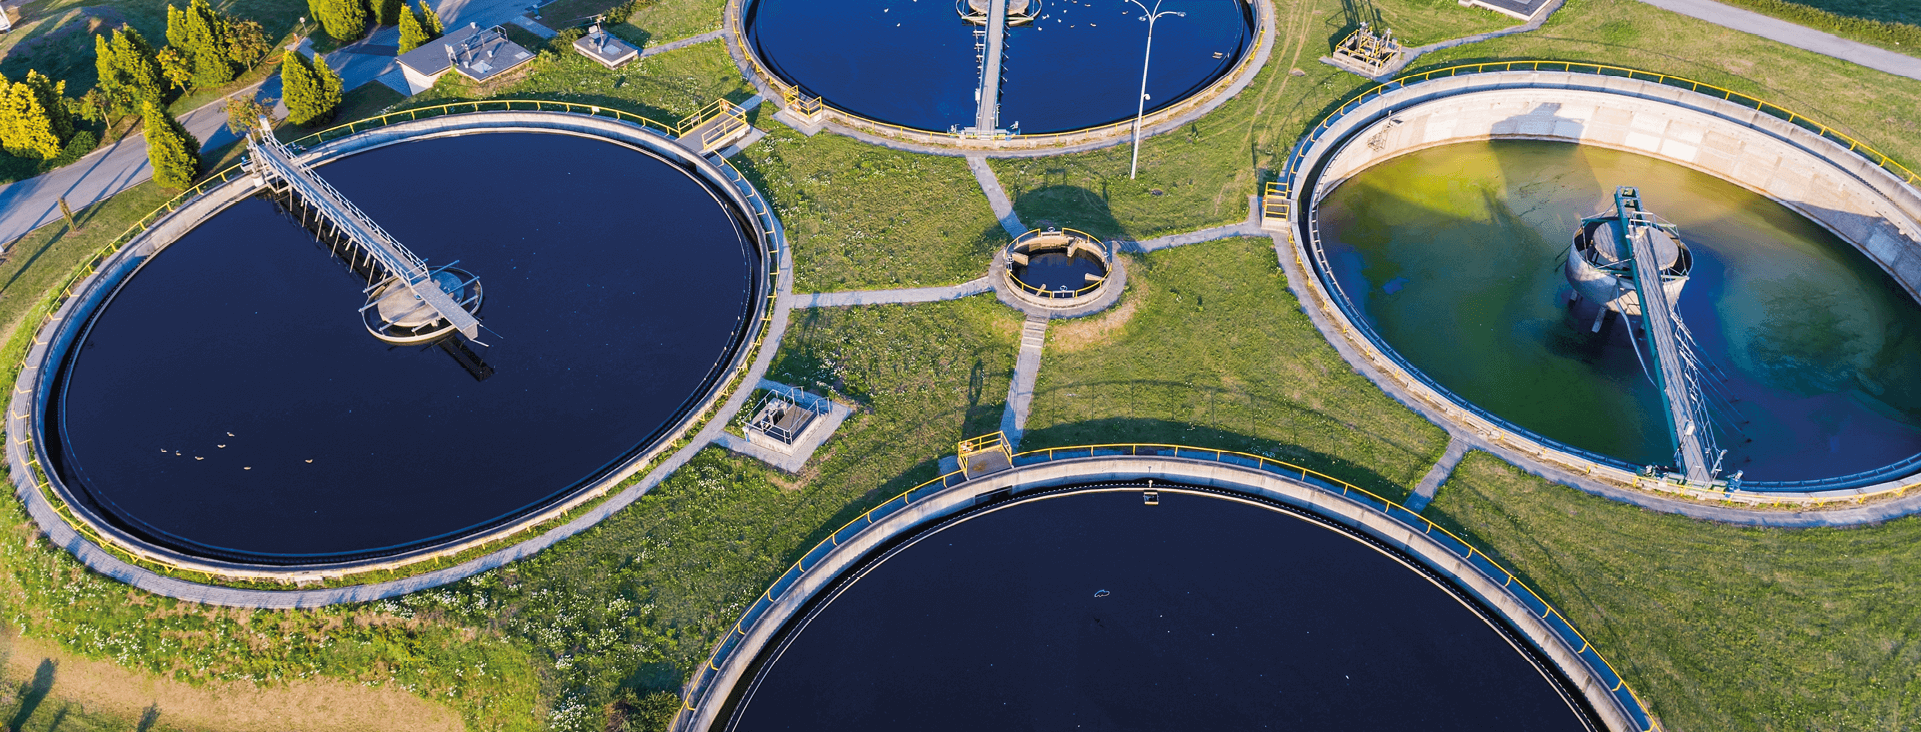
Water is an essential resource for the Company. There is no shortage of water sources in the regions where our facilities are based. According to the Water Risk Atlas and Water Risk Filter, all PhosAgro production sites are located in areas with low or moderate fresh water scarcity. However, access to clean water is a major issue facing the world.
Risks and opportunities
The main risks related to water consumption are water quality deterioration in water bodies across PhosAgro’s footprint and the Company’s non-compliance with statutory requirements for limiting negative impact on water bodies.
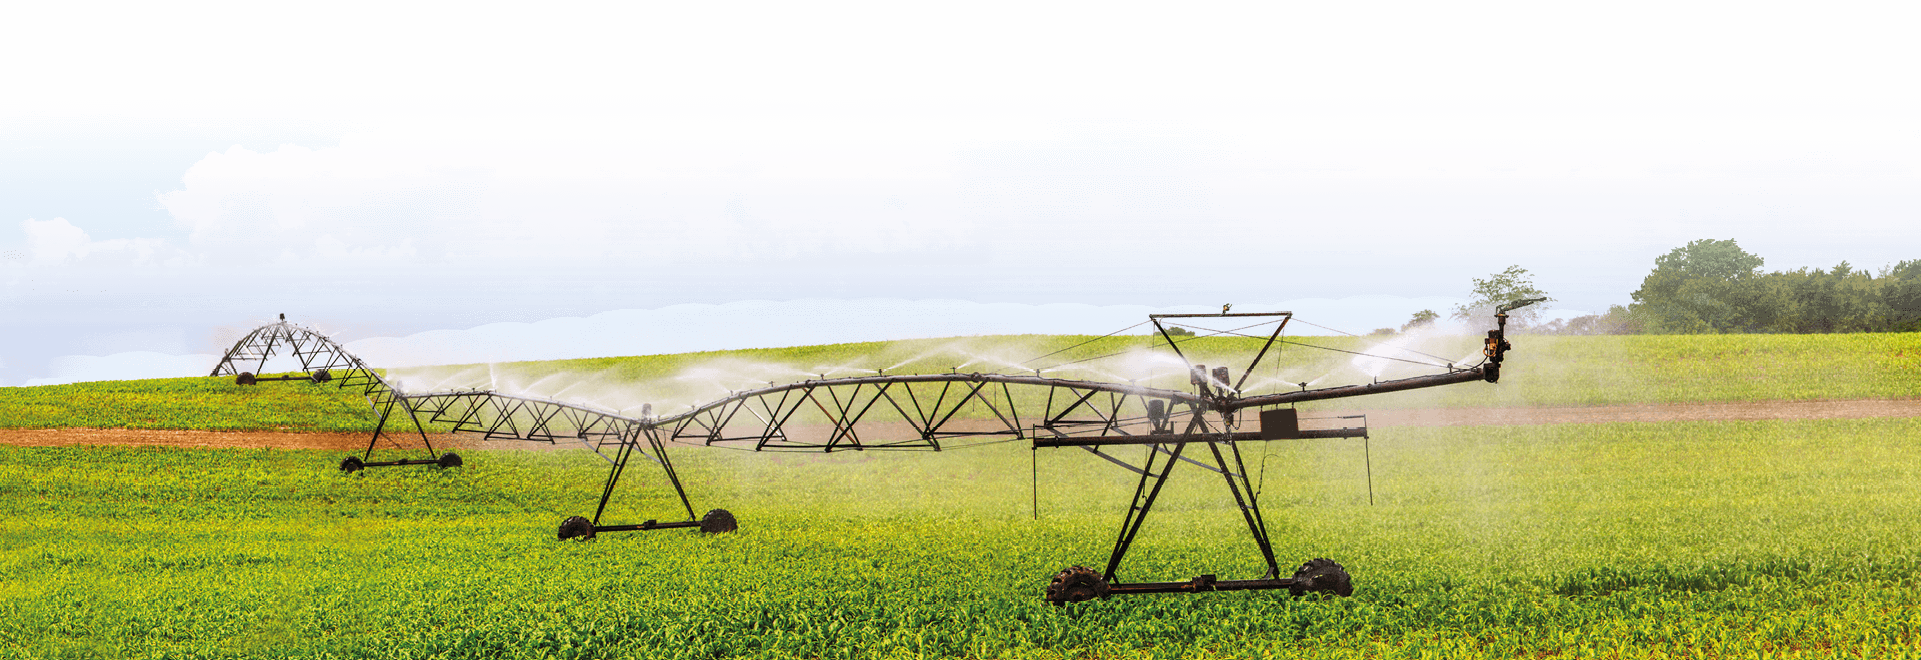
PhosAgro has implemented closed-loop water recycling systems at its sites in Volkhov and Balakovo to reuse water in production processes.
Going forward, we plan to improve waste water management by focusing on maximum reuse of water through closed-loop water recycling systems and better treatment of effluents discharged into water bodies in addition to ongoing monitoring of water bodies in the regions of operation.
The regulatory risks include tightened waste water quality requirements, as well as restrictions on the amount of water consumed and discharged into both water bodies and centralised waste water systems. There were no incidents of non-compliance associated with water quality permits, standards, and regulations.
To mitigate these risks, in 2020 we adopted and started implementing a Water Strategy that seeks to reduce water consumption and discharge and improve waste water quality.
The strategy is implemented at all PhosAgro sites, and we regularly analyse these measures to determine whether they are sufficient and effective enough to achieve our targets.
To identify the impact of the Company's operations on water bodies, we monitor these bodies in accordance with adopted programmes by engaging our own certified laboratory and external certified laboratories.
Key initiatives in 2022
At the Cherepovets site, we completed the first stage of the water use optimisation programme as part of our production upgrade initiative for 2022–2025
- Engineering documentation developed for the project named The Technical Upgrade of a Water Treatment Station in a Utility and Drinking Water Supply System with Arrangements Made to Dehydrate Sludge Water at the Phosphate Facility of Apatit.
- Pilot tests completed and core technical solutions developed for the technical upgrade of an acidic waste water treatment station, with the drafting of engineering documentation underway.
- A base case design developed for the project named A Waste Water Treatment Unit with a Source Water Capacity of at Least 400 m3 /h at the Phosphate Facility of Apatit. The general designer responsible for the facility’s design (construction, networks, auxiliary systems) is NIUIF.
- The development of engineering documentation is underway for the project named A Saline Waste Water Sewerage at the Phosphate Facility of Apatit. The documentation is expected to be completed in 1Q 2023.
- Implementation of the Water Use Optimisation Programme at the Cherepovets site of Apatit as part of the production upgrade initiative for 2022–2025.
- Work started to design a saline waste water treatment unit. The designer of the saline waste water facilities is NIUIF.
- As part of the Electricity Generation Based on the System of Chemical Water Treatment (Heat and Power Plant) initiative, the Volkhov branch successfully piloted the reuse of effluents resulting from boiler blowdown at a heat and power plant and chemical water treatment concentrate. This led to the reduction of waste water discharged into sanitary protection zones by 135 tonnes per hour.

Water consumption includes both mining and pit waters. The volume of mining and pit waters depends on the intensity of precipitation and the size of the catchment area. It tends to increase with the development of new horizons.
Preservation of biodiversity in regions of PhosAgro Group’s operation at a level securing sustainability
Strategy and management approach
The Company’s Environmental Policy sets forth PhosAgro’s obligations to preserve biodiversity, natural landscapes and habitats across its footprint and prevent its projects from causing any harm to the same.
Before building any new production facilities or renovating existing ones, PhosAgro conducts an environmental impact assessment (EIA) based on the results of engineering and environmental surveys. Assessment of the local flora, fauna and landscapes, as well as research, analysis and consideration of public attitudes towards biodiversity protection are integral to our EIA procedures.
For a number of years, the Company has been working to preserve biodiversity and replenish biological resources. In 2020, the Company started developing comprehensive biodiversity protection programmes in partnership with research institutions. The effort is aimed at assessing and restoring environmental conditions across the Company’s footprint and establishing its priorities in protecting biodiversity based on indicator species monitoring.

Key initiatives in 2022
Comprehensive biodiversity protection programmes were implemented at the Volkhov branch, one of the Kirovsk branch’s facilities and Apatit’s Cherepovets production site.
In 2022, the Cherepovets facility completed research of flora and fauna within the footprint of pyrite cinder storage facility No. 1–3 (System for Hydraulic and Dry Stacking of Pyrite Cinder).
The research revealed that the area’s wildlife includes endemic European and Siberian species and is typical of the Vologda region.
The field and desktop studies proved that none of the plants or animals found in the reviewed area are included in the Vologda region’s Red Data Book or in the Red Data Book of the Russian Federation.
As part of the efforts to develop biodiversity protection programmes, the Company joined forces with Kolsky Research Centre of the Russian Academy of Sciences to conduct a comprehensive environmental study of the area within the footprint of Apatit’s Kirovsky mine. The researchers walked over 150 km of trails and completed 62 geobotanical descriptions. The total distance walked to take stock of the endemic birds and mammals exceeded 121 km. The study of hydrobionts was carried out at three stations and lasted from July until September.
The research revealed that the biome of terrestrial ecosystems within the footprint of the Kirovsky mine includes over 900 species of fungi, lichens, mosses and vascular plants, as well as 135 species of birds and 11 species of mammals. The realm of lichens and plants within the footprint of the Kirovsky mine is amazingly diverse and idiosyncratic, which is a reason enough to develop designated initiatives for protecting the unique flora of the Khibiny Mountains. The diversity of bird and mammal species was strongly affected and disturbed by human activities in the area. Their incidence in natural habitats corresponds to standard incidence in slightly disturbed areas and predictably enough shows signs of structural transformation in populations inhabiting areas impacted by humans. Water ecosystems within the footprint of the Kirovsky mine exhibit relatively high taxonomic diversity due to a wide range of conducive factors. The efforts to take stock of fish fauna within the footprint of the Kirovsky mine led to the identification of four fish species. Lake Bolshoi Vudyavr currently fits the habitat requirements for these species, as it offers ample food supplies for both salmonids (brown trout, Arctic char) and European smelt.
As part of the programme for environmental monitoring of biome (flora and fauna), the Volkhov branch researched an area within the sanitary protection zone.

The study of the area within the footprint of Apatit’s Volkhov branch revealed that structure of animal species across the reviewed biotopes is typical for the region in question. A total of 52 bird species were found to live within the facility’s footprint and in adjacent areas.
RUB mln
